How does this strange scoring system work?
The quiz is not primarily testing whether you can guess Peru or Greenland. It is testing whether you know how sure you should be. The goal is to make your probability estimates match reality.
1. The basic idea
Start hereFor every picture you have 100% to distribute between Peru and Greenland. You are not required to pick one and pretend to be certain. You can say 50/50, 60/40, 80/20, or anything in between.
When you submit, the true country is revealed immediately. Your score depends on the probability you assigned to the country that turned out to be correct.
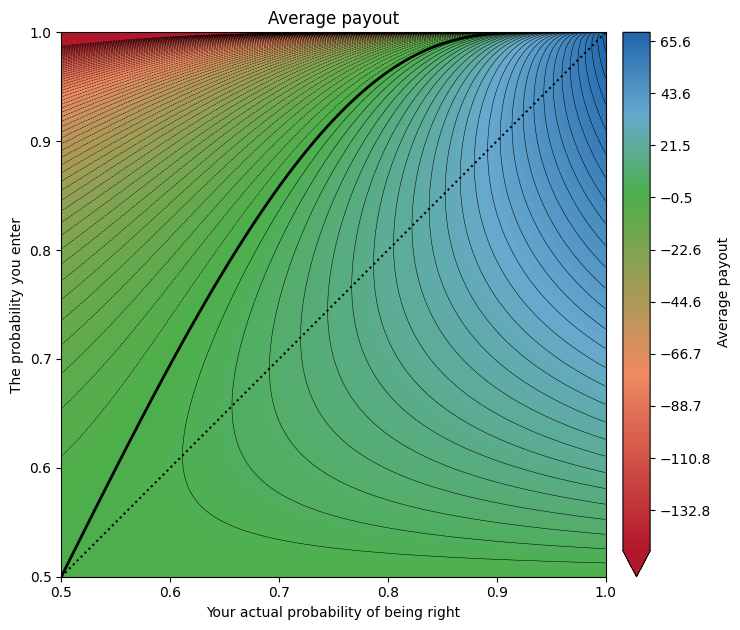
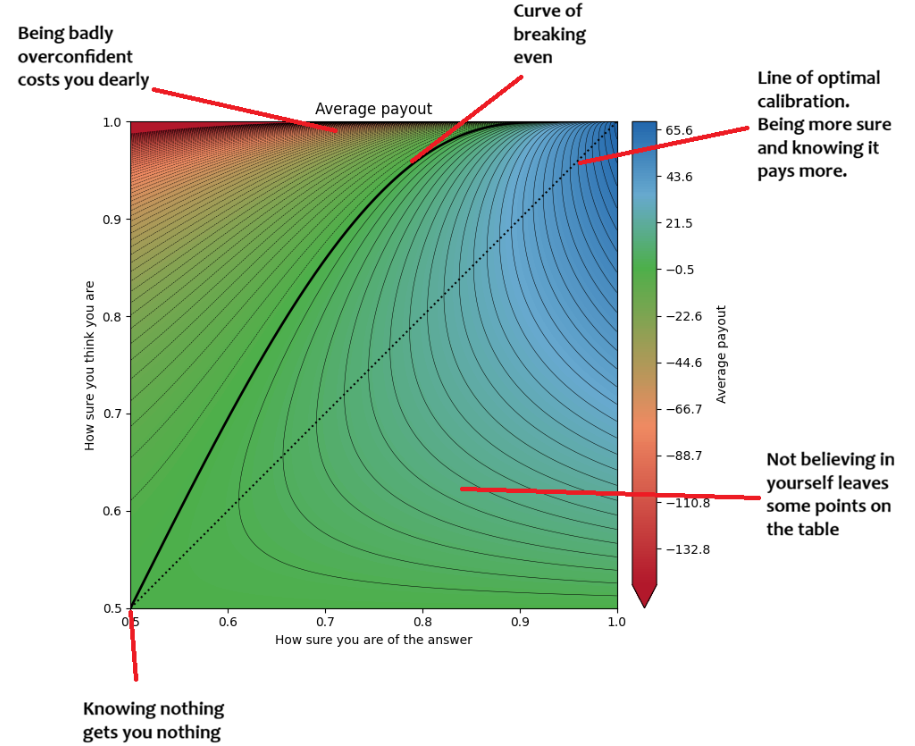
If you really think the answer is 80% Peru, putting only 55% on Peru costs you some expected points. You are leaving information value on the table.
If you think Peru is only 60% likely but put 99% on it, you get a spectacular reward when you happen to be right — but a spectacular penalty when you are wrong.
2. The graph
The whole scoring system at a glanceThe graph below asks a hypothetical question: suppose that, in situations like this one, your chosen answer would actually be correct q of the time. What happens to your average score if you report a probability p?
3. What do the points actually feel like?
Two possible countriesFor a two-option question, if you put probability p on an option, a correct answer gives you 100 × ln(2p) points. If it is wrong, the other probability is 1 − p, so you get 100 × ln(2(1 − p)) points.
| Your probability | If correct | If wrong |
|---|---|---|
| 50% | 0 | 0 |
| 60% | +18 | −22 |
| 70% | +34 | −51 |
| 80% | +47 | −92 |
| 90% | +59 | −161 |
| 99% | +68 | −391 |
The values are rounded to whole points. The logarithm is deliberately unforgiving near 0% and 100%.
4. Why the logarithm?
For the mathematically curiousHere is the neat part. Suppose your genuine belief that an answer is correct is q, but you report p. Your expected score is
We can ask: which value of p gives the highest expected score?
Set this equal to zero:
q/p = (1 − q)/(1 − p)
q(1 − p) = p(1 − q)
p = q
And the second derivative is
so this is not merely a stationary point: it is the unique maximum. In other words, if you want to maximize your expected score, you should report your actual probability.
🧠 The extra-nerdy information-theory version
The loss from reporting p instead of your true belief q can be written as
The expression in brackets is the Kullback–Leibler divergence between two Bernoulli distributions:
KL divergence is always non-negative and is zero only when p = q. So every deviation from your genuine probability has a measurable expected cost.
This is why the logarithmic score is called a proper scoring rule. It makes honest probability reporting optimal. It is not the only possible proper scoring rule — the Brier score is another — but the logarithmic score has a particularly direct connection to information and makes extreme overconfidence very expensive.
5. So how do I actually play well?
Practical advice- Separate “which is more likely?” from “how likely?”
You might be fairly sure that Peru is more likely than Greenland while still thinking Peru is only 65% likely. - Use your first impression, then ask how often that impression would be wrong.
That second question is often where useful uncertainty appears. - Pay attention to the downside.
If an 80% guess is wrong, the −92 point result is much larger than the +47 you get when it is right. That is not a bug: it is what prevents you from simply choosing the most likely-looking answer at 99% every time. - 50/50 is not failure.
If the picture genuinely contains no useful information, 50/50 is the mathematically sensible answer. - Learn your own calibration.
The statistics page shows whether your 60%, 70%, 80% and 90% predictions actually come true at roughly those rates.
6. A few practical details
For completenessHow are pictures selected?
Every attempt receives 10 random Peru pictures and 10 random Greenland pictures, shuffled together.
Can I change an answer?
You can change the probabilities while working on the current picture. Once you press Answer, that question is locked and scored.
What happens if I quit?
Your progress is saved after every answer. An abandoned 4/20 attempt remains in the data as a partial quiz.
What do the public statistics show?
The site can show completed high scores, aggregate quiz statistics, calibration statistics, and per-picture difficulty. IP addresses are kept out of the public displays.